Kieran Healy’s visualization “A Co-Citation Network for Philosophy” represents patterns of co-citation for articles from four journals over a twenty year period.
In the introduction on the visualization page, Healy says that he was interested in seeing what the major topics and trends had been in the scholarship for the given period. While his data set included over 2,000 individual articles, the visualization only shows the top 500 ranking articles (a total of 520 to allow for items with the same ranking).
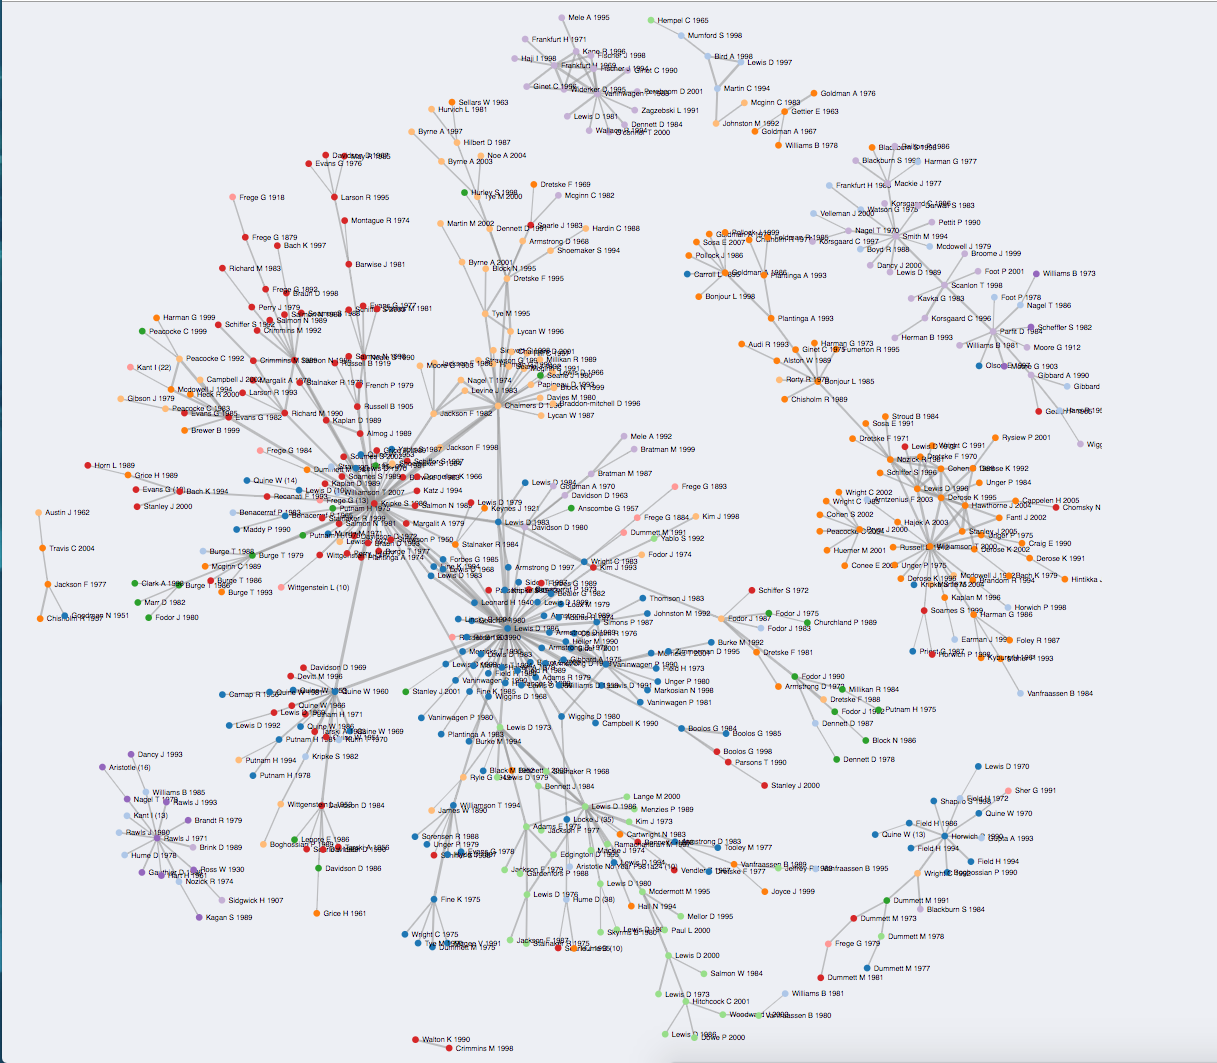
The page containing the visualization has a few paragraphs of introductory text, introducing the research question and describing the nodes. The visualization is interactive insofar as visitors can click and drag nodes to pull them out of a particularly dense area, but once released the node snaps back to place. Each node is labelled, most with the author and date of each piece. While this shortened citation reduces the visual clutter, always an issue with network visualizations, it does render the findings opaque to those unfamiliar with the names of authors, much less the dates of major articles.
However, the visualization does not stand alone; Healy initially wrote an in-depth discussion of the project (linked to in the short introduction), which was followed by two posts in response to additional questions. The original post, created in conjunction with the visualization, gives a more detailed explanation of the choices which went into making the dataset, for example the decision to only include items with at least ten citations, which led to the roughly 500 nodes in the visualization. It also offers what Healy calls “impressionistic observations” – images of specific clusters in the visualization identifying what the conversation(s) are which those co-citations are capturing.
In the two following posts, “Lewis and the Women” and “Citation Networks in Philosophy: Some Followup,” Healy not only further investigates the patterns revealed by the visualization but responds to questions raised by colleagues, an act made possible by the fact that he shared the visualization and write up on the web. While Lewis’ prominence in the citations is evident by looking at the network, the additional questions concerning changing the timespan and the proportion of women in the data set arose as much from conversation around the visualization as they did from Healy’s own research interests.
What would a co-citation network analysis of your field look like? What gaps or imbalances might it reveal? What conversations might be sparked by sharing a visualization of your data?