Voyages: Trans-Atlantic Slave Trade Database, http://slavevoyages.org/, makes available and contextualizes a data set of the voyages of the Atlantic slave trade from the 16th through the 19th centuries.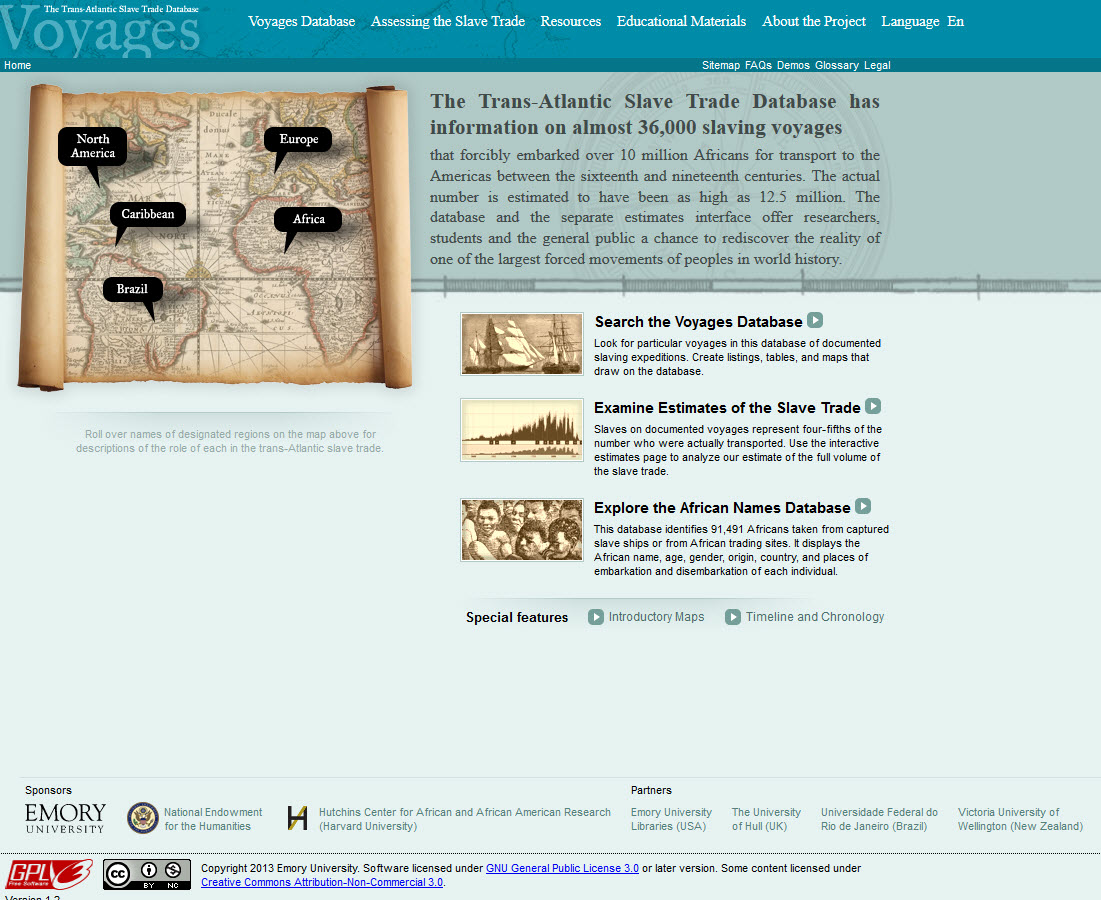
Summary: The site is composed of several sections, focusing respectively on the database, the study of the slave trade, resources and materials for classroom use, and the project’s history. The three primary sections – Voyages Database, Assessing the Slave Trade, Resources – all include interactive data sets; the data sets of the latter two sections are drawn from the primary slave voyages database, and used to present information specific to a research question.
In addition to the data sets, the site contains content which contextualizes, interprets, and enhances the database. Essays in the section “Assessing the Slave Trade” offer an overview of the scholarly approach to the study of the slave trade, and demonstrate how the information in the database might be used for traditional textual arguments. The maps in the same section were created with data from the data set, and were part of a scholarly publication; another form of interpretive argument. In the Resources section, a compilation of images of manuscripts used to create the database, places mentioned, slave trade vessels, and enslaved individuals help to provide a more real-world context or the tabular data. For educators, there are lesson plans aimed at middle and high school classrooms, along with a list of web resources.
Audience: The site is primarily aimed at scholars who study the slave trade or the eras during which slave trading occurred, particularly those who might contribute to the data sets. Additional audiences include students at the undergraduate or graduate level, who could make use of the database, data sets, and interpretive content.
Available Data: Although there are multiple searchable data sets on the site, the core of the site is the Trans-Atlantic Slave Trade Voyages database. The original sources of the data are from manuscript archives, including – but not limited to -newspaper advertisements, naval records, government documents, personal letters, account books, and ship logbooks. The creators of the database used these sources to determine the details of every ship (name, captain, owners), each voyage (origin, stops, destination), the number of people enslaved, and other details. A result of the variety of sources and the breadth of information captured is a data set with a large number of variables and which is not precisely tidy.
The primary data set, the slave trade voyages, is accessible through the database at http://slavevoyages.org/voyage/search. However, beyond simply offering up the data in this familiar form, the site creators have also written an extensive guide to understanding the methodology of the data set and database, which is even available to download as a PDF for offline consultation. By writing the guide, the site authors have provided users with a resource to help them better understand – and therefore make better use of – the database. Moreover, the creators gave themselves documentation which they can come back to as they add to, or even revise, the database and data sets.
Consider the list of variables. Note that this list has indications as to whether a variable comes directly from the data sources or is calculated (the asterisk next to the name). The list of variables is particularly useful for people who want to dig into the data: the site creators have the raw data available for download in multiple formats, enabling other scholars to make use of the data for their own scholarly needs. While some might balk at the idea of sharing their research data, this set was the result of collaboration and the site content comes from multiple contributors who have made use of the data for their own research questions.
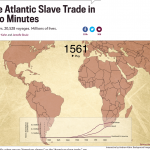
Further, publishing the data has made the project more visible: in 2015, authors at the online magazine Slate used the data to create an animated, interactive visualization of the slave voyages (Andrew Kahn and Jamelle Bouie, “The Atlantic Slave Trade in Two Minutes”, Slate, June 25 2015). This visualization was shared over 300,000 times on Facebook, greatly increasing awareness of the Slave Voyages Database.
Even without downloading the data, the database search makes it possible for users to drill down into the very large data set through a multi-faceted search interface. Working from the labels on the image below, users have the option to: define a date range (1); select basic variables (2) which appear in the display of the current query (3); and create a permanent link to the query (4) which is particularly useful in research or when citing the database. The results are not only given in a table of the results (5, first tab) but users have the ability to view their search results in a variety of ways, allowing further analysis of the data.
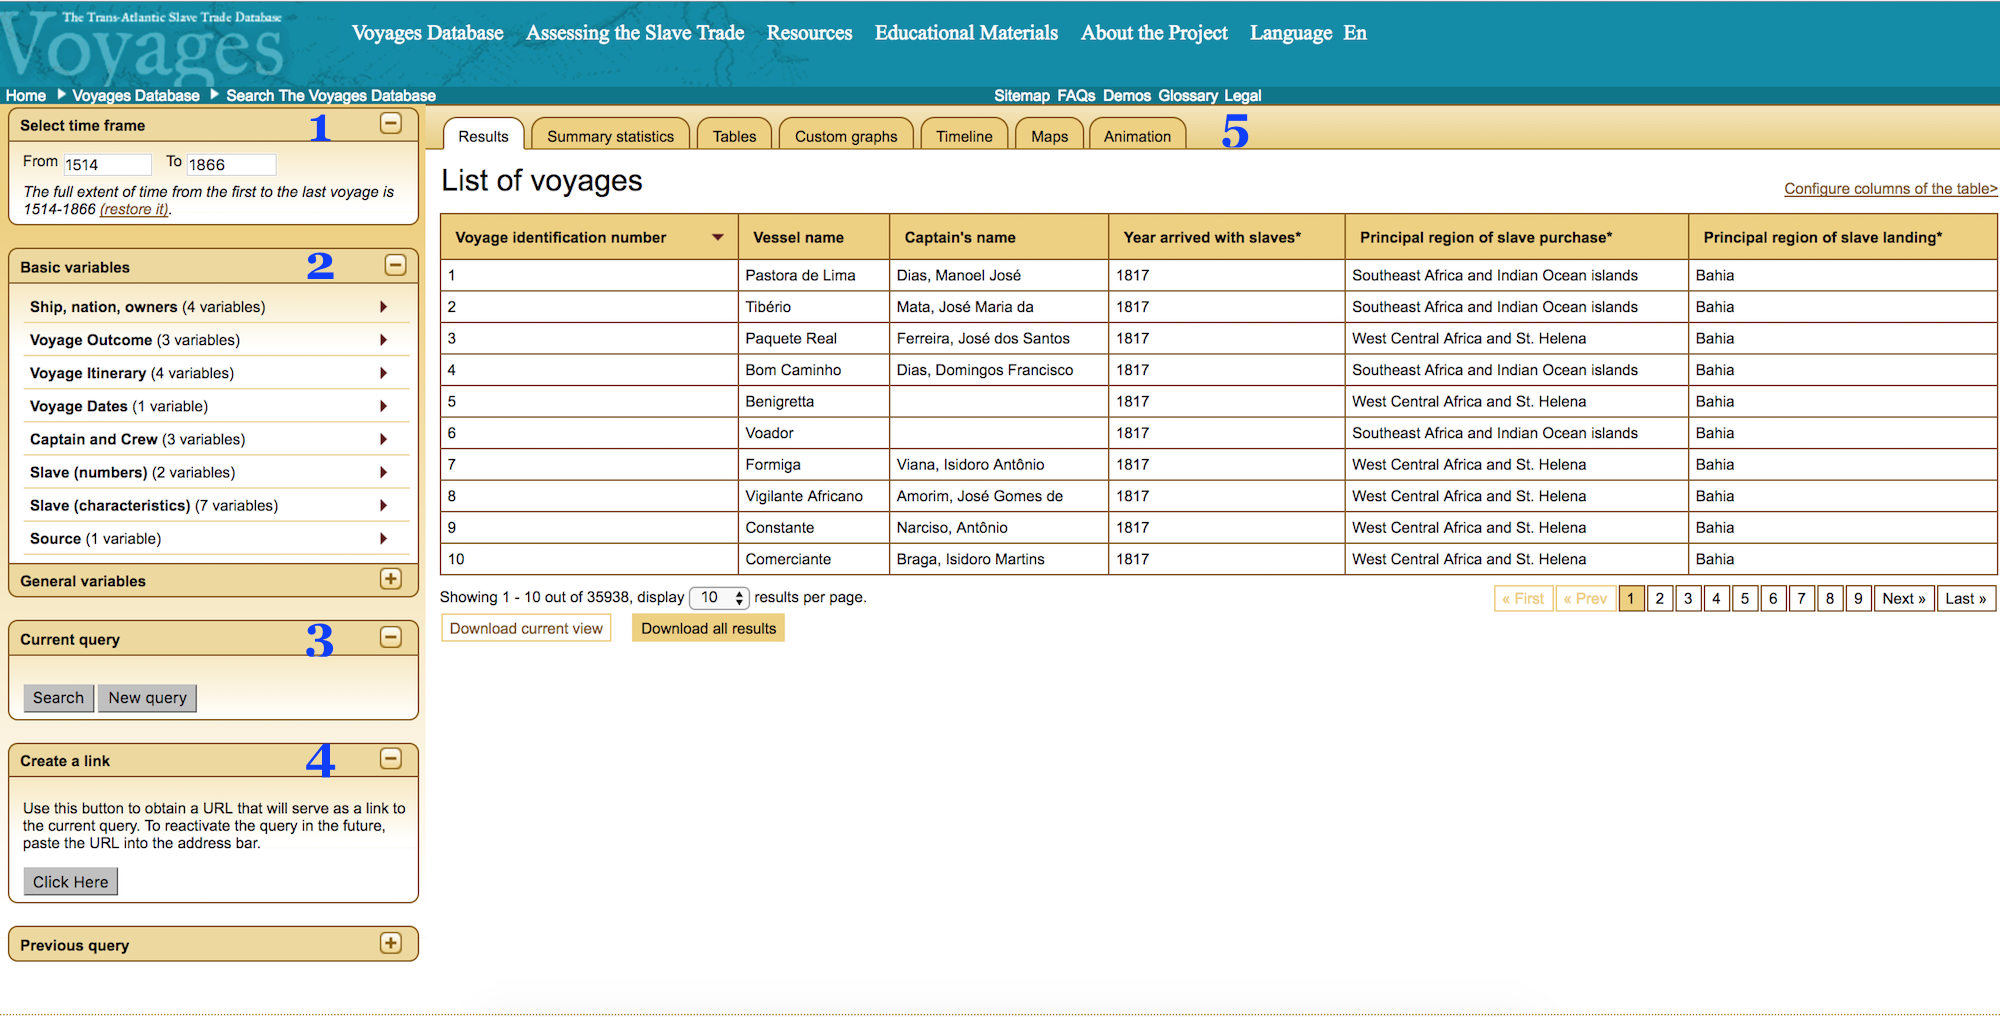
http://slavevoyages.org/voyage/search
The Estimates database contains fewer variables, as it is solely concerned with the volume of the transatlantic slave trade, and has simpler search and view options. The third database on the site is the African Names Database, which draws from the same sources as the other two, but with the objective of uncovering the names of African individuals who were enslaved; its directly connects with the African Origins project, an outgrowth of the original Slave Trade Voyages project.
The Trans-Atlantic Slave Trade Voyages Database site is driven by data, which it makes available and accessible in a number of formats – databases, text explanations and interpretations, and downloadable raw data. Are there data-rich projects which make their data similarly accessible in your field? How might you share your data with fellow scholars, with students, or enthusiasts?