OpenRefine is a software tool for cleaning and transforming data. These exercises will introduce you to the basics of using OpenRefine to create tidy – or at least tidier – data.
General documentation for OpenRefine is written in a GitHub wiki which is only searchable if you install a browser extension. If you accidentally close your OpenRefine project, you can open it from http://127.0.0.1:3333/ as long as the application is still running on your computer.
Activity one: Cleaning Data
Complete the Cleaning Data with Open Refine lesson at the Programming Historian.
We recommend that you read through the entire lesson once – skimming the how-to sections as needed, in order to get a sense of the trajectory and scope of the lesson. Then go back through and follow the lesson. The notes below offer some advice possible technical hitches in the process, and point to aspects of thinking about data which are illuminated by the lesson.
Technical hitches:
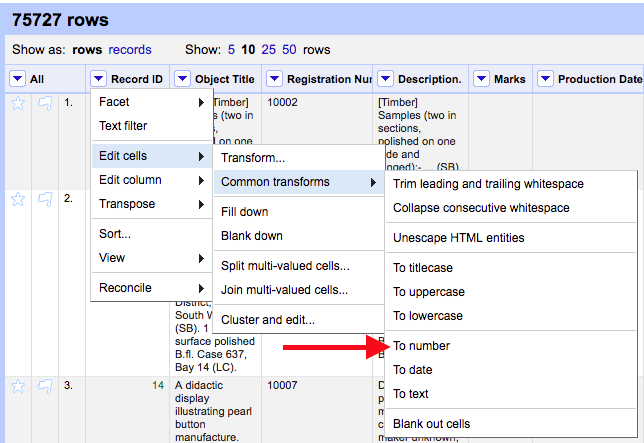
Note that you may need to edit the column “record id” to format the data as number and not text. To do this: select the triangle button for the record id column to open menu; select Edit cells > common transforms > to number (see image below). Once the column has been transformed, the record ids should display as green, rather than black.
In the section titled “Applying ad-hoc transformations,” the lesson has you undo the faceting and clustering of categories. Once you have resolved the issue of the nine phantom records (up to the “* * *\” notation), you may want to go back and again facet and cluster the category data.
Thinking about Data:
Be sure to take some time to explore the data, as the Programming Historian authors recommend in the section “get to know your data.” When working with your own data, you will likely be familiar with the data structure, but it is always wise to look over a data set to ensure that everything imported properly and to re-familiarize yourself with the data structure of a specific data set.
Atomization, Faceting and Clustering allow us to normalize the data, as discussed in some the readings. Through these processes, you break categories into their composite parts, remove empty entries, and standardize data entry for errors such as capitalization inconsistencies. Think about what data entry errors these methods might miss, and how you might resolve those errors.
Activity Two: Unpivoting data
For the second activity, we will be creating tidy data from a csv of prices of goods in Dijon, France, in the 16th and 17th centuries. This dataset comes from Data Sets for Historians.
- In this GitHub repository, find the file you want to download and click it to view the contents.
- Find the Raw button, and right click (if you have a PC) and Save As.
- Or, click the Raw button to reveal the contents of the file. Select all and copy into a plain text editor, and save the file as a CSV.
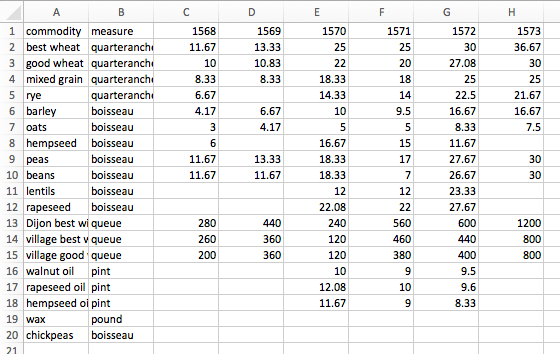
This dataset is what Wickham would call untidy and Kosara would describe as “spreadsheet thinking.”
The way the data is structured in this spreadsheet, there is a column for commodity, with a row for each kind of commodity (wheat, wax, etc), another column for the measure of the commodity, and then columns for each year from 1568-1630 display the prices of the commodities.
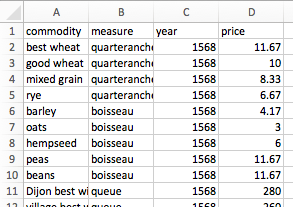
Using Wickham’s data semantics, the sheet has four values: commodity, measure, year, and price. We want to tidy the data so that each of these values has its own column, like so:
We can do this with OpenRefine in only a few steps:
1. From the OpenRefine start page, Click “Create a Project” and upload the dijon-prices csv. Click next and then create project.
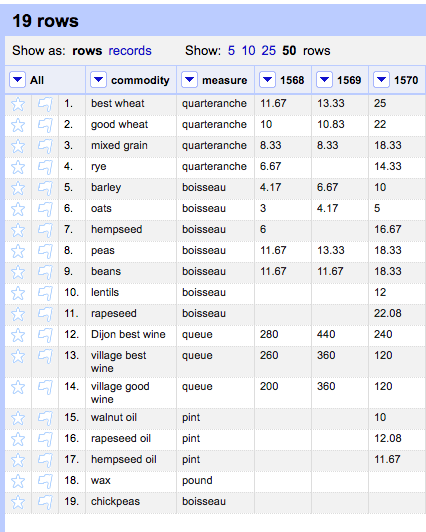
You should have 19 Rows, with the years given as headers for each column
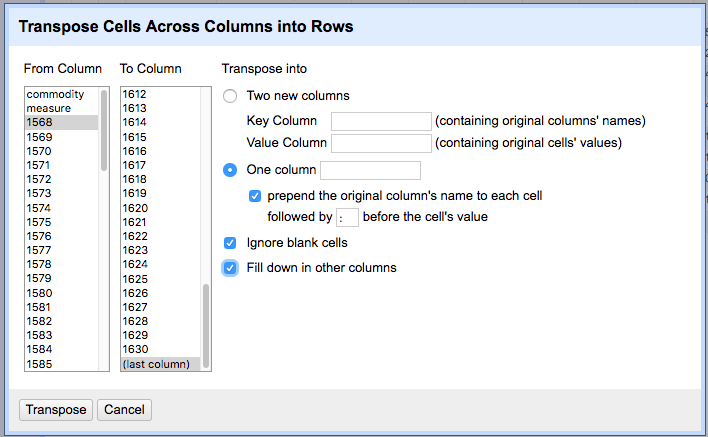
2. For the first year-labelled row (1568), click on the arrow to select the menu for that row. From the drop-down menu, select Transpose > transpose cells across columns into rows. A dialog box should load (see image below): click the radio button to “Transpose into one column” which you can name year; check the “prepend” box below it; and select the boxes for “Ignore blank cells” and “Fill down in other columns.”
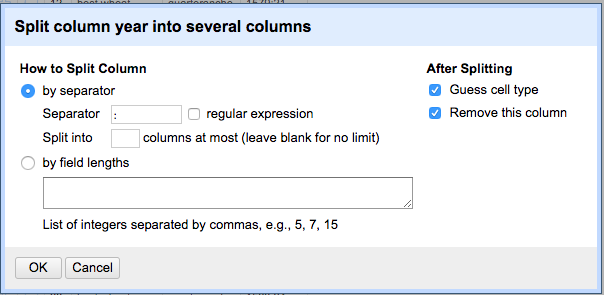
3. You should now have 110 rows, with the year and price in one column formatted as year:price, for example “1569:13.33”. To split these into distinct rows, click for the menu for this column and select Edit column > split into several columns. Change the separator from a comma to a colon and click “Ok”
4. You should now have four columns: commodity, measure, year 1 (with the year) and year 2 (with price). Rename these last two columns to their appropriate value by clicking the column menu button and selecting Edit column > Rename this column for each.
When it is done, your OpenRefine project should look like this:
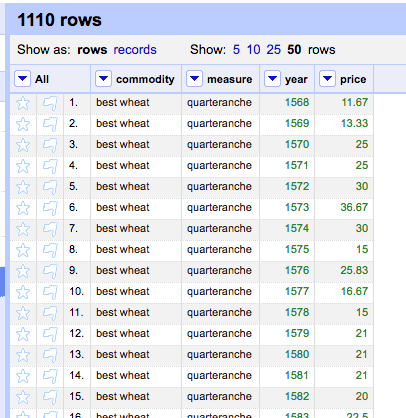
You can sort by year to have the OpenRefine project exactly match the example of a tidy dataset, and then use the Export button to save the data as a csv.
Further Resources
Curious as to what else can be done with OpenRefine? Browse the recipes and list of approved tutorials (sorted by language – English, Spanish, German, French, and Japanese).